Spike Sorting
What is it?
One of the major questions contemporary neuroscience seeks to elucidate concerns the mechanisms used by dedicated parts of brains (our brain, vertebrate brains, insect brains) to perform specific tasks. As an example of task we readily perform you can think of "segmenting" a visual scene into its parts or separating a wine "bouquet" from the after-shave smell of the man at a nearby table in a restaurant.
One way to address these questions experimentally is to record the activity of as many neurons as possible within the network performing the job we are interested in. I will argue here neither about the relevant neuronal activity one should measure, nor about the relevant scale (single neurons, groups of neurons organized in a specific way, etc) at which we should look. As soon as you get concerned with the spike sorting problem you are, implicitly at least, acknowledging that it is worth defining the proper unit of observation as a single neuron and "neuronal activity" by the action potentials (the output) generated by each neuron.
Fine, so what we want to extract from a given piece of neural tissue is a list of time sequences, with one list element per neuron and where the time sequence corresponds to the times at which the neuron emits action potentials or spikes as we call them in our jargon. We also want our list to have as many elements (neurons) as possible. One experimental technique available is mutli-electrode array (MEA) recordings. It consists in poking a bunch of electrodes (that is "wires") into the tissue. These electrodes will be located in the "extracellular space" and will thereby typically collect the spiking activity of several nearby neurons. That means that with "minimal" tissue damage, because we don't bring too many electrodes into the brain, we can in principle record many neurons.
At that stage a picture can perhaps help to get a more precise idea of what we have been talking about. In my past experimentalist life I've been routinely recording from the first olfactory relay of insects as shown on the figure below:
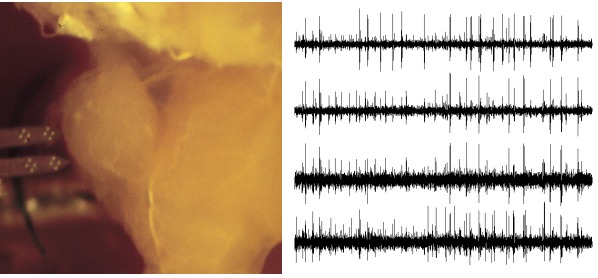
What you can see on the left is the first olfactory relay, the antennal lobe, of an insect (a locust, Schistocerca americana; this picture was made while I was a post-doc in Gilles Laurent's lab in Caltech). Almost touching the brain and coming horizontally from the left you can see a recording probe made of two silicon shanks on which 16 recording electrodes can be clearly seen as bright spots (these probes were kindly provided by "Center for Neural Communication Technology" of the University of Michigan and are now commercialized by NeuroNexus). The shanks width is 80 μm, the separation between the mid-line of the shanks is 150 μm, the diagonal of the 4 squares defined by the 4 groups of 4 recording electrodes is 50 μm long, the diameter of the first olfactory relay (the lobe against which the probe is located) is 400 μm. On the right side you can see 1 sec of data recorded from one of the 4 groups of 4. These groups of 4 recording electrodes are called tetrodes. These data were acquired after gentle insertion of the recording probe into the antennal lobe (such that the 2 two tetrodes at the tip of the probe were roughly 100 µm below the surface). The data shown were filtered with a band-pass filter between 300 and 5000 Hz. The action potentials or spikes emitted by the neurons are the sharp peaks located all along the traces.
So far so good but clearly the strength of the MEA approach: recording many neurons from each electrode, implies a problem. The raw data we collect, as shown in the figure, are a mixture of spikes coming from many neurons. In order to get to the list of spike times for each neuron we discussed before we clearly have to untangle our raw data, this is in essence the "spike sorting problem".
The following analogy can perhaps help you to get a feel for the problem. Imagine a room where several people are sitting and talking. The likely range of people number is known, but the precise number is not. Their language is unknown to us and sometimes several of them talk simultaneously. In our analogy these people correspond to neurons. We have placed one or several microphones in this room and now record the compound sound generated by the superposed discourses. Our task is to find out:
- How many people talk during the recording?
- What are some of the characteristics of the sounds emitted by each person (pitch of the voice, loudness, variability, statistics)?
- What is the discourse of each person?
To pursue the analogy, the microphone(s) correspond to the recording electrode(s). Some obvious features that our discourse reconstruction algorithm should use are the loudness and pitch of the people's voices (in our analogy the pitch corresponds to the spike waveform and the loudness, or amplitude, is related to the distance of the neurone to the electrode). Some people do, moreover, speak a lot while others just utter a comment from time to time. We could therefore use the average frequency with which people talk. These three ingredients constitute the core of nearly every automatic spike-sorting algorithm presently available. But there is much more information in the data, for example, the auto-correlation of the discourse of each person. What a person has been saying until now should indeed allow us to predict partially what she will say next. The loudness with which people talk is moreover often modulated by the prosody of the pronounced phrase (e.g., in French a phrase is typically pronounced louder at the beginning than at the end). It turns out that the "neurons' discourse" exhibits properties similar to those. The inter spike intervals (ISIs) are never exponentially distributed and have often non-trivial features potentially useful for spike-sorting. The signals emitted by neurons often exhibit a short term non-stationarity like during a period of intense activity where the spike amplitude decreases.
Examples
An example of sorting using R on spontaneous recording from a locust antennal lobe is available as well as the source Org file of the analysis. The same example using python is available as well as the Org source file; a version in PDF format—with slightly fewer figures but an "extensive" introduction—can be found in a manuscript written with Georgios Detorakis (Org source file is also available).
Another (unfinished yet) example of sorting on spontaneous recording from rat cerebellar slice is available as well as the source Org file of the analysis.
A partial analysis of a freely availabe an "easy" data set from the Buzsáki lab. The source Org file is available.
A partial analysis of a freely availabe and "difficult" data set from the Buzsáki lab. This document is very close to what I actually do when analysing a data set from a preparation with which I do not have any previous experience; that is, different strategies are tried out. The source Org file is available.